
|
On 22 February 2011, I was in the biosecurity lab of the Von Haast building at the University of Canterbury, doing the mind-numbing but critical task of treating my samples from Timor to allow them to be released from secure storage. Upstairs on the top floor (a wooden add-on of that since-replaced building that we called the marshmallow because it shook so much worse than the rest of the building in an aftershock), six little glass vials containing zircons from already-treated samples were arranged along the back of my desk. Not near the front where they might fall off in an earthquake. No sir, all along the back where they would be safe.
I was just packing up my laptop ready for lunch at 12:51 when the shaking started. It was violent but a lot shorter than the shaking from the 4 September quake. Nevertheless, it was a significant shake, clearly much >M5 and us Christchurch peeps prided ourselves as walking seismometers by then. I was wearing a lab coat and crocs (my shoes were upstairs) but there was no way I was going into the marshmallow during a vigorous aftershock period so I skedaddled with my laptop and bag out to the muster area, patting myself mentally on the back for putting the zircon vials nice and safe at the back of the desk. To quote the Tui beer advertisement, “Yeah, right!”. When we finally got back into the building, I discovered the vials, smashed on the floor under the desk. Once at the muster point, we were told to disperse and head home. I was still wearing my crocs and lab coat, and for some reason was not able to get my bike out of the secure parking. It was only 10 km home, so off I traipsed to begin two hours of my life that I would rather forget. Well worn crocs are basically tread-free and the closer I got to town the more mud I encountered. It was everywhere, bubbling up merrily around power and light poles, bubbling up out of massive potholes and cracks in the road, and lying in great opaque sheets that were impossible to get around and terrifying to go through. I wore the crocs when I could see the concrete/tar and took them off when I couldn’t. On, off. On, off. On, off. Progress was slow but faster than it seemed to be for the cars crawling along next to me, inching their way past unluckier, stuck cars. Everybody seemed remarkably patient. As I started to make my way through Hagley Park, on the western edge of the city, I started to get a real feel for how bad things really were. Two middle aged women passed me, their faces covered in blood, laughing. One was trying to walk in heels, the other carried a single shoe. The other shoe was presumably lost forever. Huge gashes rent the beautifully manicured golf course, and the greens were grey brown, shiny and slick with the gloss of new liquefaction. Soon the evidence of the devastation became ever clearer. More people. More tears. More blood. A pall of smoke. The throb of helicopters. There I first saw a helicopter climbing steeply away from the Avon with an underslung monsoon bucket. I knew this wasn’t guilt-free earthquake geology anymore. As I emerged on the east side of Hagley Park I looked up at the 10 story ‘Terrace on the Park’ apartment complex, for which I did much of the electrical distribution work in 2000, saving my earnings for my wedding. One of them swayed particularly ominously as I looked up and I felt a wave of nausea. I started to make my way nervously along Salisbury Street, torn between the wish to go and see if I could help and the desire to get home to my family. I lived in Avondale and I knew it wasn’t going to be pretty there. Family won, I kept going. Home. I soon passed the intersection of Salisbury Street and Victoria Street, where the historic clock-tower was obviously damaged. A multi-storey building on the north side was clearly leaning and swaying every time an aftershock shook it. I moved into the middle of the street, between rows of almost-stationary cars, hoping that the cars would offer protection if the building fell. I felt trapped. The walk was slippery, even barefoot, and I used the cars several times to stay upright. Nobody seemed to mind. And still the people flowed around me, in various states of despair, euphoria, disbelief. Soon there were more people walking between cars than on the footpath. Some drivers simply abandoned their cars. As I drew level with the swaying building, I could see a pharmacist inside, busily locking the drugs away. I didn’t understand his commitment to what seemed to me a pointless task. Within the next few days, the building was surrounded by a clear drop-zone in-case it fell, but it was subsequently successfully demolished. On the opposite side of the road, I passed by the Crown Plaza, where I spent my wedding night, and the town hall, where I had graduated with my BSc and MSc. Both were soon demolished. As I walked, people started to talk. People passing would tell you what they knew. People joining the flow from a side street would pass on information. “You’re lucky you’re not in a car mate, Gloucester Street bridge is down”. Not down as it turned out, but impassable to cars. “Fitzgerald Avenue is in the fuckin’ Avon!” Yes, that was about right. “Eastgate mall has collapsed” – not exactly, just the carparking building fortunately, but that was another thing for which I felt some responsibility, having been an electrical contractor who worked on the mall expansion. “Cashel and Colombo are a mess fella”. Little did I know how much of a mess, but even so I thought about the lovely proprietors of the wee music shop where I bought ukuleles for my wife and daughters. I hoped they were safe. I think they were. And worst of all: “The CTV building is on fire”. Actually collapsed and on fire as it turned out. That explained the monsoon buckets. I kept doggedly moving, through the pall of dust and smoke. Past a little collapsed brick garage. I had no desire to see a building on fire. I never even saw the 9-11 disaster, having been on an army promotion course and on exercise at the time. Our wise troop commander told us that we needed to think very carefully if we wanted to watch it and I decided not. I never have and never will. As I walked, still between rows of cars, I started telling drivers what little I had heard so that they could make route decisions. I soon realized what had happened to the bridges, the approaches rendered useless because the bridges stood proud while the banks and abutments sank and narrowed. You could climb on and walk across but certainly not drive. The further east I went, the worse the liquefaction seemed. Large swathes of river bank had collapsed, tearing roads apart and lowering the dismembered surfaces into the water. Cars were creeping cautiously past, hoping not to end up in the river in an aftershock. I slithered along in my crocs. Eventually, just over two hours after leaving uni, I made it home. I checked on my family and my incredibly almost intact house but I really needed to do something. Eastgate mall was nearby and I’d heard it was down so I grabbed my hard hat, boots and a bike and headed off. There was nobody there, just a security guard and a fencer busy fencing off the damaged carpark. A guy in high-vis doing a police job on the intersection told me that evacuees were being collected in Hagley Park, so I headed for town on my bike, recklessly tearing through puddles with little idea of how deep they were. I was lucky. One guy died that day doing just that. I reached Hagley Park and asked what I could do to help. The red cross guy said they were critically short of warm gear. It was getting cold and starting to rain. A hardware company had dropped off hundreds of sheets of ply and people were huddled in groups under angled sheets of ply, trying to stay dry. I jumped back on my bike and headed for home. Blankets I could do. Back home I grabbed spare blankets and duvets and stuffed them into our bike kiddie trailer. I still had heaps of room so I headed up the street. Soon the trailer was full. Even my mother-in-law’s dressing gown was in there. Twenty five minutes later I was back at the park, increasingly tired but still going. I headed up to the organizers and tried to hand over blankets but they were too busy. “Just find somebody and give them what you’ve got mate”. Ok! The next couple of minutes were surreal. I spotted a large group of old people huddled under a board or two and took my trailer that way. They were so happy and we started chatting. Turns out that they were a bunch of geo-tourists, mostly retired British Geological Survey people. They had been out visiting Sumner when the earthquake happened, so they were pretty close to the epicentre. They were the first to give me a hint of the scale of damage out there but they were in remarkably good humour. There were a few jokes about coming out to New Zealand to look at active tectonics but preferring it a little less active than that. One of the ladies was shivering quite hard and was most delighted to have MIL’s dressing gown. Next I bumped into a fellow PhD student colleague who was there with her husband, trying their best to help others. Seems like a lot of people had the same idea. The next few days were a period of adjustment, getting used to a new reality, smugly eking out our earthquake supplies. The petrol stove and gas barbeque were fired up and the solar showers dusted off. The cans of food were sorted. Our toilets were out of bounds and many people dug long-drop toilets. We smugly brought out the camping chemical toilet and dug a long-drop to take the products. Eek! A neighbour had a deep, capped well on his property with a 2m high pole. It blew the cap off and was fountaining so he attached a vacuum cleaner hose to it with duct tape and put it out through the fence, attached to a stool. We went down there daily to fill water containers, boiling them religiously. Soon the council started trucking water in and we could walk a few hundred meters further for drinking water. Luxury! Especially with a two-seater bike trailer/pushchair! Fuel doesn’t last forever, whereas the lack of electricity and local fuel stations certainly seemed to do so. In the first few days, the street had cook-your-freezer parties in the street park and that cut into the fuel a bit. Finally, a couple of fuel stations opened but they were 10 km away, northwest of us and on the other side of the Avon River. The bridges were out of action and there was no way out there by car. Meals and supplies were being brought in by helicopter (Thanks people of Rangiora!!!). I did a quick recce of the bridges on my bike and concocted a plan. I collected jerry cans and gas cylinders from people in the street and stashed them in the bike trailer. When I got to the bridge, I unloaded the trailer and lifted all the containers onto the bridge. Then I decoupled the trailer, lifted that onto the bridge and then the bike. Reverse procedure at the other side and I was across the river and 8 km from the petrol station. I got to the petrol station in a sweaty mess to discover lonnnnng queues of west Christchurch cars. Lucky buggers I thought. Lucky and kind as it turned out. When I joined the queue they quickly figured out where I was from (the dreaded east) and I quickly found myself leapfrogging up the queue as consecutive drivers spotted me and let me go in front of them. I took about 10 min to negotiate a 2 hour queue! The lady at the petrol station didn’t think my carriage was quite legal for the c.80 kg of liquid and gaseous fuel it contained in a 40kg rated trailer, but she agreed she could not think of a better solution. It was a long ride home, weighed down for the last 2 km with an extra few liters of water provided by a friendly Rangiora guy in a ute. He had filled his ute tray with bottled water and was sitting there handing it out to anybody who walked across the bridge. Legend! He even helped me get my load across. Life slowly started to return to normal, but it’s hard to know where to end this story because, to be honest, it doesn’t end. It didn’t end when the power came back on, or the water. It didn’t end when plane-loads of chemical toilets were delivered around the city. It didn't end when we were allowed to use toilets again nearly a year later. It didn’t end when we were finally allowed back into the city, which my daughter described so eloquently as building mince. It didn't end when I finally stopped flinching when trams make the ground rumble in Melbourne where I now live. It didn’t end when we replaced the damaged sewer in our now-rented house three years ago. I don’t consider myself overly traumatized, probably because knowledge is power and I learned a lot about that quake. I have always been a softy but I am certainly more emotional now than I was before. I also get that regular reminder when I hear loud bangs in my ears, or can’t hear something properly because of the damage done to my ears by an awful sinus infection following the earthquake. Whoever heard of earthquake-related hearing loss. Who knows if the echoes of that earthquake will ever end? Christchurch is still busy moving on and so am I.
0 Comments
A magnitude 7.3 earthquake that struck at a depth of about 200km beneath the Banda Sea on Monday prompted office buildings to be evacuated in Darwin, some 700km away. This is a complex and seismically active region, where the Australian tectonic plate collides with microplates on the edge of Asia in the Indonesian region. The location of this earthquake is no surprise. Three earthquakes greater than magnitude 6 occurred within a few kilometres of each other and within the same general area in 2016 and 2018. Nor is the size of the quake particularly out of the ordinary. A magnitude 7.1 earthquake struck here in 1962, and a magnitude 7.3 earthquake in 1983. 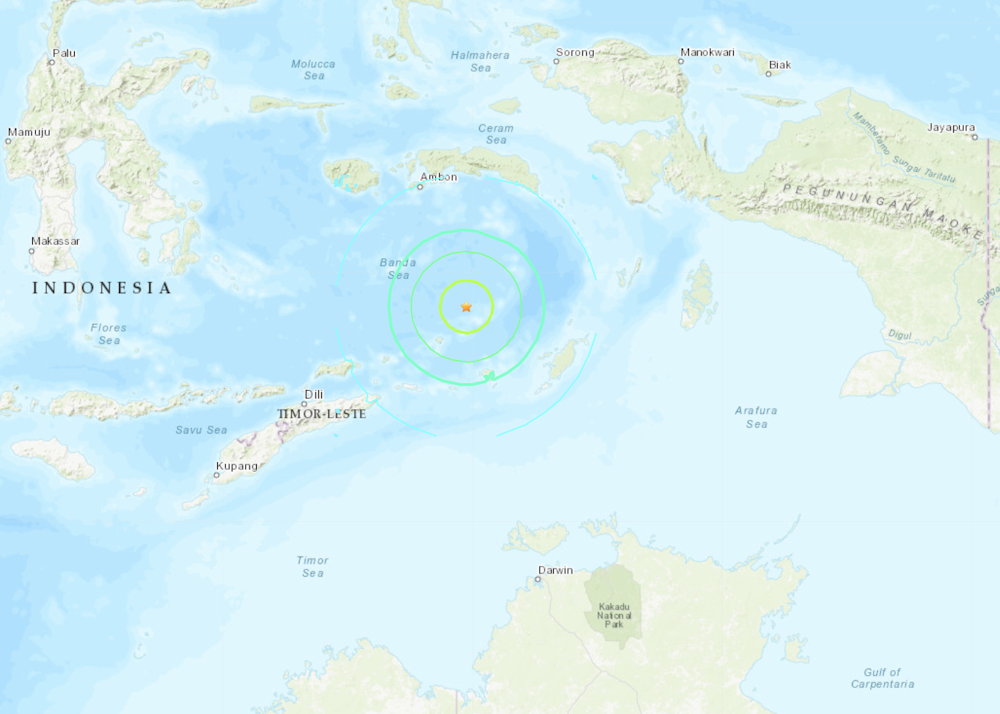
Why is this zone so active?Even though this seismic zone is at the boundary between two tectonic plates, these earthquakes occur within the Australian tectonic plate, and owe their character to variations in the type of crust that makes up the northern part of the plate. Where the Australian Plate collides with Asia, some of it has slid (subducted) under the volcanoes of Eastern Indonesia, and is descending into the mantle. This process is driven by buoyancy (the tendency of material to sink or float). Continental crust is more buoyant, and thus resists sinking into the mantle. Ocean crust, meanwhile, is denser and has more of a tendency to sink. As the Australian Plate travels northward, the front edge is high-density ocean crust, and the part following behind it is lower-density continental crust. Where one part of a plate subducts easily and starts to sink and the other wants to float and refuses to subduct, a tear can develop, and this is what we believe is happening north of Darwin. The northern edge of the Australian Plate used to be made up of ocean crust that is now completely subducted. The buoyant Australian continent is refusing to subduct, and as a result the ocean crust is tearing off as it sinks into the mantle. In the region of Timor this tearing seems to have happened already, so there is virtually no seismicity at similar depths for several hundred kilometres west of this earthquake in the vicinity of Timor. Earthquakes cannot occur where there is a hole in the plate, and instead they mainly happen at the spot where the tear is growing. A useful analogy to visualise this is tearing a piece of cheese – the kind of pre-sliced, soft cheese that you put on your sandwiches. The picture below shows a piece of cheese that is bent around a cylinder (representing the descent of the plate into the mantle), and is torn along one edge. 
As the tear in the cheese (plate) gets longer, earthquake activity stops where there is no longer any cheese (plate) present, and gets more intense at the point where the tear is happening. The official earthquake record from the US Geological Survey indicates that this earthquake consisted of a combination of lateral displacement and vertical extension (lengthening), which is consistent with our cheese analogy. The vertical extension is caused by the stretching of the crust while lateral displacement, known as strike slip, probably accommodates the eastward movement required by the continuing attachment of the slab east of the earthquake. Why did it rock Darwin so hard?Earthquakes such as this occur within the Australian plate, and the seismic waves travel through the cold, strong Australian plate quite efficiently. This means that it did not lose much of its energy before reaching Darwin. This is particularly true for long-period (low frequency) waves, which disproportionately affect tall buildings, causing them to move quite violently. This is consistent with news reports that offices in Darwin’s central business district were evacuated and are now being assessed for damage. In contrast, the city of Dili, which is closer to the earthquake, experienced only minor wobbling for less than 10 seconds, according to Federation University geology lecturer Nicole Cox, who is visiting Dili. Seismic waves emanating from the lower plate have already weakened considerably by the time they pass through the upper plate to reach Dili. Local earthquakes are relatively infrequent around Darwin, because like the rest of Australia it sits on strong continental crust, relatively far from a plate boundary. However, earthquakes like today’s are quite common. Queensland seismologist Kevin McCue has compiled a long list of earthquakes that affected Darwin, including many from the region of the Banda Sea that produced today’s earthquake. Even in 1900, local people recognised the relative normality of severe Banda Sea earthquakes. Aftershock sequences from these types of events commonly include a few earthquakes greater than magnitude 6, and ten or more above magnitude 5. The key to managing this hazard is preparedness and carefully considered action in the aftermath of the earthquake. Now is probably as good a time as any for Territorians and other Australians to re-read the advice of state emergency services on how to be safe when an earthquake strikes, and the best places to take cover. Brendan Duffy, Lecturer in Applied Geoscience, University of Melbourne and Mark Quigley, Associate professor, University of Melbourne This article is republished from The Conversation under a Creative Commons license. Read the original article.
Richard N Holdaway; Ben Kennedy, and Brendan Duffy, University of Melbourne
Just like a teenager wanting to be older, volcanoes can lie about their age, or at least about their activities. For kids, it might be little white lies, but volcanoes can tell big lies with big consequences. Our research, published today in Nature Communications, uncovers one such volcanic lie. Accurate dating of prehistoric eruptions is important as it allows scientists to correlate them with other records, such as large earthquakes, Antarctic ice cores, historical events like Mediterranean civilisation milestones, and climatic events like the Little Ice Age. This gives us a better understanding of the links between volcanism and the natural and cultural environment. Taupo’s last violent eruptionLake Taupo, in the North Island of New Zealand, is a globally significant caldera supervolcano. The caldera formed after the collapse of a magma chamber roof following a massive eruption more than 20,000 years ago. Now it seems that the Taupo eruption that occurred in the early part of the first millennium has been lying about its age. But like many lies, it was eventually found out, and it reveals exciting processes we hadn’t understood before. The eruption of Taupo in the first millennium has been dated many times with radiocarbon, yielding a surprisingly large spread of ages between 36CE and 538CE. Radiocarbon dating of eruptionsRadiocarbon dating of organic material is based on the concentrations of radioactive carbon-14 in a sample remaining after the organisms’ death. Over the past two decades, the method has been refined greatly by combining it with dendrochronology, the study of the environmental effects on the width of tree rings through time. Radiocarbon dating of tree ring records has allowed scientists to construct a reliable record of the concentration of carbon-14 in the atmosphere through time. In principle, this composite record allows eruptions to be dated by matching the wiggly trace of carbon-14 in a tree killed by an eruption to the wiggly trace of atmospheric carbon-14 from the reference curve (“wiggle-match” dating). Scientists presently use wiggle-match dating as the method of choice for eruption dating, but the technique is not valid if carbon dioxide gas from the volcano is affecting a tree’s version of the wiggle. The effect of volcanic carbon on eruption agesOur study re-analysed the large series of radiocarbon dates for the Taupo eruption and found that the oldest dates were closest to the volcano vent. The dates were progressively younger the farther away they were. 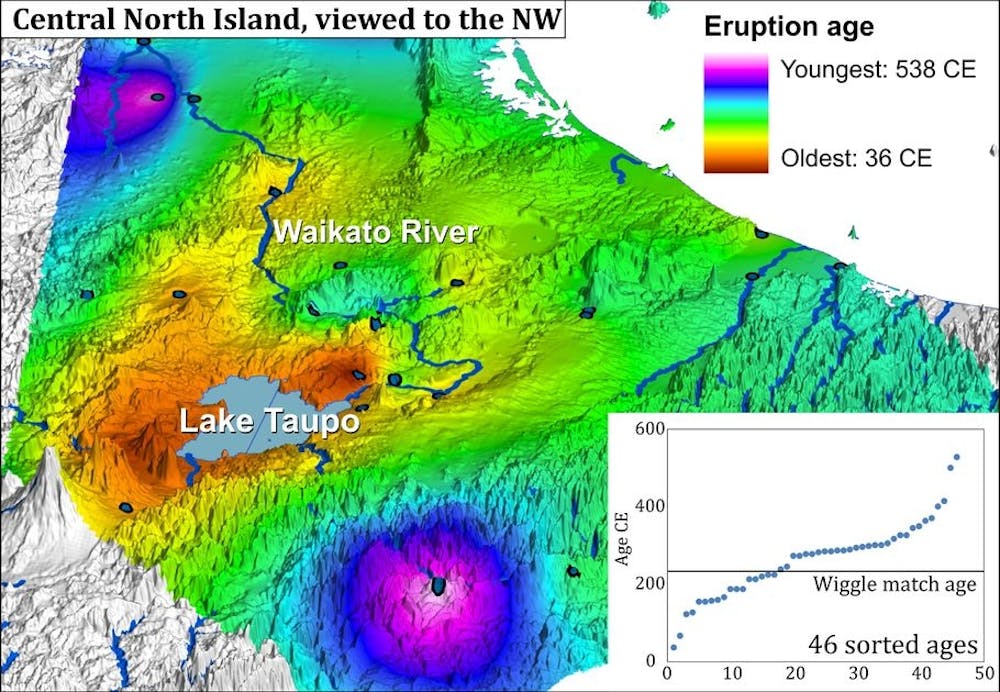
This unusual geographic pattern has been documented very close (i.e. less than a kilometre) to volcanic vents before, but never on the scale of tens of kilometres. Two wiggle match ages, taken from the same forest, located about 30km from the caldera lake, were among the oldest dates from the series of dates. This enlarged influence of the volcano can be explained by the influence of groundwater beneath the lake and its surroundings. The Taupo wiggle-match tree grew in a dense forest in a swampy valley where volcanic carbon dioxide was seeping out of the ground and was incorporated in the trees. 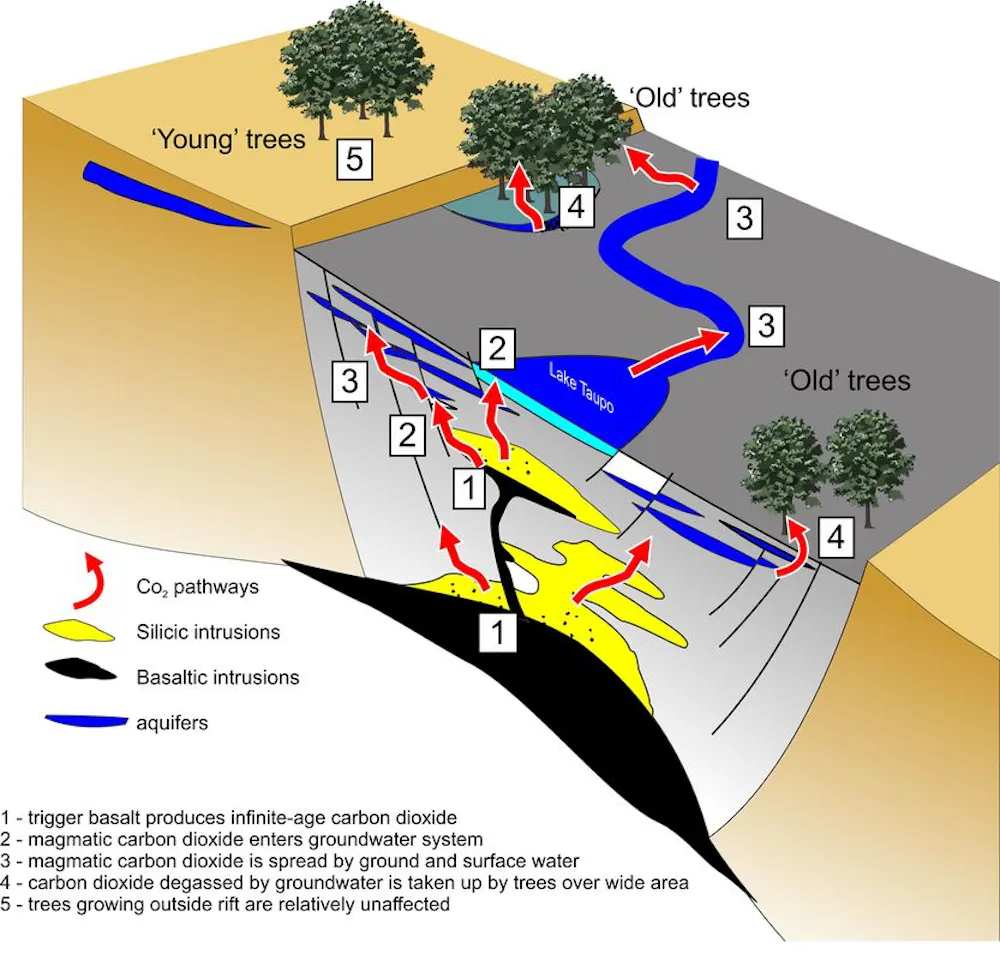
The ratio of carbon-13 to carbon-12 (the two stable isotopes of carbon) in the modern water of Lake Taupo and the Waikato River tells us that volcanic carbon dioxide is getting into the groundwater from an underlying magma body. Can large eruptions be forecast over decades?Our study shows that a large and increasing volume of carbon dioxide gas containing these stable isotopes was emitted from deep below the prehistoric Taupo volcano. It was then redistributed by the region’s huge groundwater system, ultimately becoming incorporated into the wood of the dated trees. The increase was sufficiently large over several decades to dramatically alter the ratios of different carbon isotopes in the tree wood. The forest was subsequently killed by the last part of the Taupo eruption series. But the dilution of atmospheric carbon-14 by volcanic carbon made the radiocarbon dates for tree material from the Taupo eruption appear somewhere between 40 and 300 years too old. The precursory change in carbon ratios gives us a way to gain insight into the forecasting of future eruptions, a central goal in volcanology. We found that the radiocarbon dates and isotope data that underpin the presently accepted “wiggle match” age reached a plateau (that is, stopped evolving normally). This meant that for several decades before the eruption, the outer growth rings of trees had ‘weird’ carbon ratios, forecasting the impending eruption. We re-analysed data from other major eruptions, including at Rabaul in Papua New Guinea and Baitoushan on the North Korean border with China and found similar patterns. The anomalous chemistry mimics but exceeds the Suess effect, which reversed the carbon isotopic evolution of post-industrial wood. This implies that measurements of carbon isotopes in 200-300 annual rings can track changes in the carbon source used by trees growing near a volcano, providing a potential method of forecasting future large eruptions. We anticipate that this will provide a significant focus for future research at supervolcanoes around the globe. Richard N Holdaway, Adjunct Professor; Ben Kennedy, , and Brendan Duffy, Lecturer in Applied Geoscience, University of Melbourne This article is republished from The Conversation under a Creative Commons license. Read the original article.
Brendan Duffy, University of Melbourne and Mark Quigley, University of Melbourne
At least two people have died in the magnitide 7.5 earthquake that struck New Zealand’s South Island early on Monday, local time. Preliminary modelling suggests that the earthquake was caused by a rupture of a northeast-striking fault that projects to the surface offshore. But this may be a complex event, involving several faults on the South Island. The northern part of the South Island straddles the boundary between the Pacific and Australian tectonic plates. The jostling between these plates pushes up rocks that create mountains including the Southern Alps and the beautiful Seaward Kaikoura Range, one of New Zealand’s most rapidly uplifting mountain ranges. The plate motion forces the oceanic crust of the Pacific plate beneath the Australian plate on thrust faults, and also causes the plates to slide laterally with respect to one another on strike-slip faults. The region affected by the recent earthquake has been one of the most seismically active in New Zealand over the past few years, including earthquakes that occurred as part of the Cook Strait earthquake sequence in 2013. It is likely that these sequences are related given their close spatial and temporal association. What slipped during the earthquake?The preliminary analysis strongly suggests that most of the energy release during this earthquake was sourced from the rupture of a roughly 200km-long fault system. This fault system is aligned northeast and dips to the northwest, beneath the northern part of the South Island. It coincides roughly with the subduction thrust in this area. The potential for large earthquakes on the subduction fault in the lower North Island and upper South Island of New Zealand was recently highlighted by GNS Science, New Zealand’s geological survey. It published evidence for two similar events in the Blenheim area roughly 520-470 years ago, and 880-800 years ago. Given its setting, this latest earthquake may be structurally complex, involving a mixture of plate boundary thrusting, lateral slip on strike-slip faults, and thrusting within the Pacific plate close to the epicentre, some 15km northeast of Culverden. The largest aftershocks suggest a mixture of thrusting and strike-slip movements. The damage caused by the earthquakeBecause the fault system was large, and the earthquake apparently started at the southwest end of the fault and propagated to the northeast, the seismic energy was released over a period of up to two minutes. Large earthquakes produce more long period wave energy than smaller events. The 2011 Christchurch earthquake contained a lot of high-frequency energy and very strong ground accelerations, exposing more than 300,000 people to very strong to intense ground shaking. In contrast, this recent earthquake was manifested in Christchurch as lower-frequency rolling, and due to the sparse population density in the earthquake region, roughly 3,000 people in the upper South Island experienced strong ground shaking equivalent to the Christchurch earthquake. Reports are emerging of at least one major fracture in the ground surface that could be related to strike-slip faulting in the Clarence region. More traces may yet be found given the complexity of the earthquake. Tide gauge analysis will help to understand if a similar trace offshore caused the tsunami. The earthquake has also triggered liquefaction in coastal areas and in susceptible sediments, and landsliding of up to a million cubic metres along steep susceptible cliffs in the northern South Island. There are reports of extensive road damage including in the area between Hanmer Springs and Culverden, much of State Highway 1 and even Wellington, on the North Island. Most of this damage is probably caused by strong ground shaking, which causes weak ground to move en masse and has resulted in numerous slips and road closures in the central and northern South Island. Earthquakes, aftershocks and the pull of the moonGiven the earthquake happened on the eve of a supermoon full moon, and the closest the Earth and moon will be since 1948, it wasn’t long before some tried to make a connection. But the tidal triggering of earthquakes has been investigated since the 19th century and remains a challenging and controversial field. Small amplitude and large wavelength tidal deformations of the Earth due to motions of the sun and moon influence stresses in Earth’s lithosphere. It is possible that, for active faults that are imminently close to brittle failure, small tidal force perturbations could be enough to advance rupture relative to the earthquake cycle, or to allow a propagating rupture to travel further than it might otherwise have done. But the specific time, magnitude and location of this or any other large earthquake has not been successfully predicted in the short-term using tidal stresses or any other possible precursory phenomenon. Deliberately vague predictions that provide no specific information about the precise location and magnitude of a future earthquake are not predictions at all. Rather, these are hedged bets that get media air time due to the romantic misinterpretation that they were valid predictions. Most earthquake scientists, including those that research tidal triggering of earthquakes, highlight the importance of preparedness over attempts at prediction when it comes to public safety. To this end, GNS Science uses a system of operational earthquake forecasts to communicate earthquake risk to concerned New Zealand residents during an aftershock sequence such as we are now entering. These forecasts are based on earthquake physics and statistical seismology. The current operational forecast indicates an 80% probability of:
This aftershock sequence will probably (98%) include several large aftershocks (some greater than magnitude 6 have already occurred), and for each magnitude 6 aftershock we expect 10 more magnitude 5 aftershocks over the coming days and weeks. Brendan Duffy, Lecturer in Applied Geoscience, University of Melbourne and Mark Quigley, Associate professor, University of Melbourne This article was originally published on The Conversation. Read the original article.
Brendan Duffy, University of Melbourne; Colin Caprani, Monash University, and Mark Quigley, University of Melbourne
Of the many devastating pictures to come out of central Italy after last week’s deadly earthquake, the clock tower of Amatrice standing defiantly amid the rubble of the town has become an iconic image. The clock tower was reportedly built in the 13th century and its solid stance defies us to understand how this remarkable structure has evaded destruction at least twice in the past 800 years. But perhaps surprisingly, it’s not unusual for tall, ancient structures to survive earthquakes. Unlikely survivors
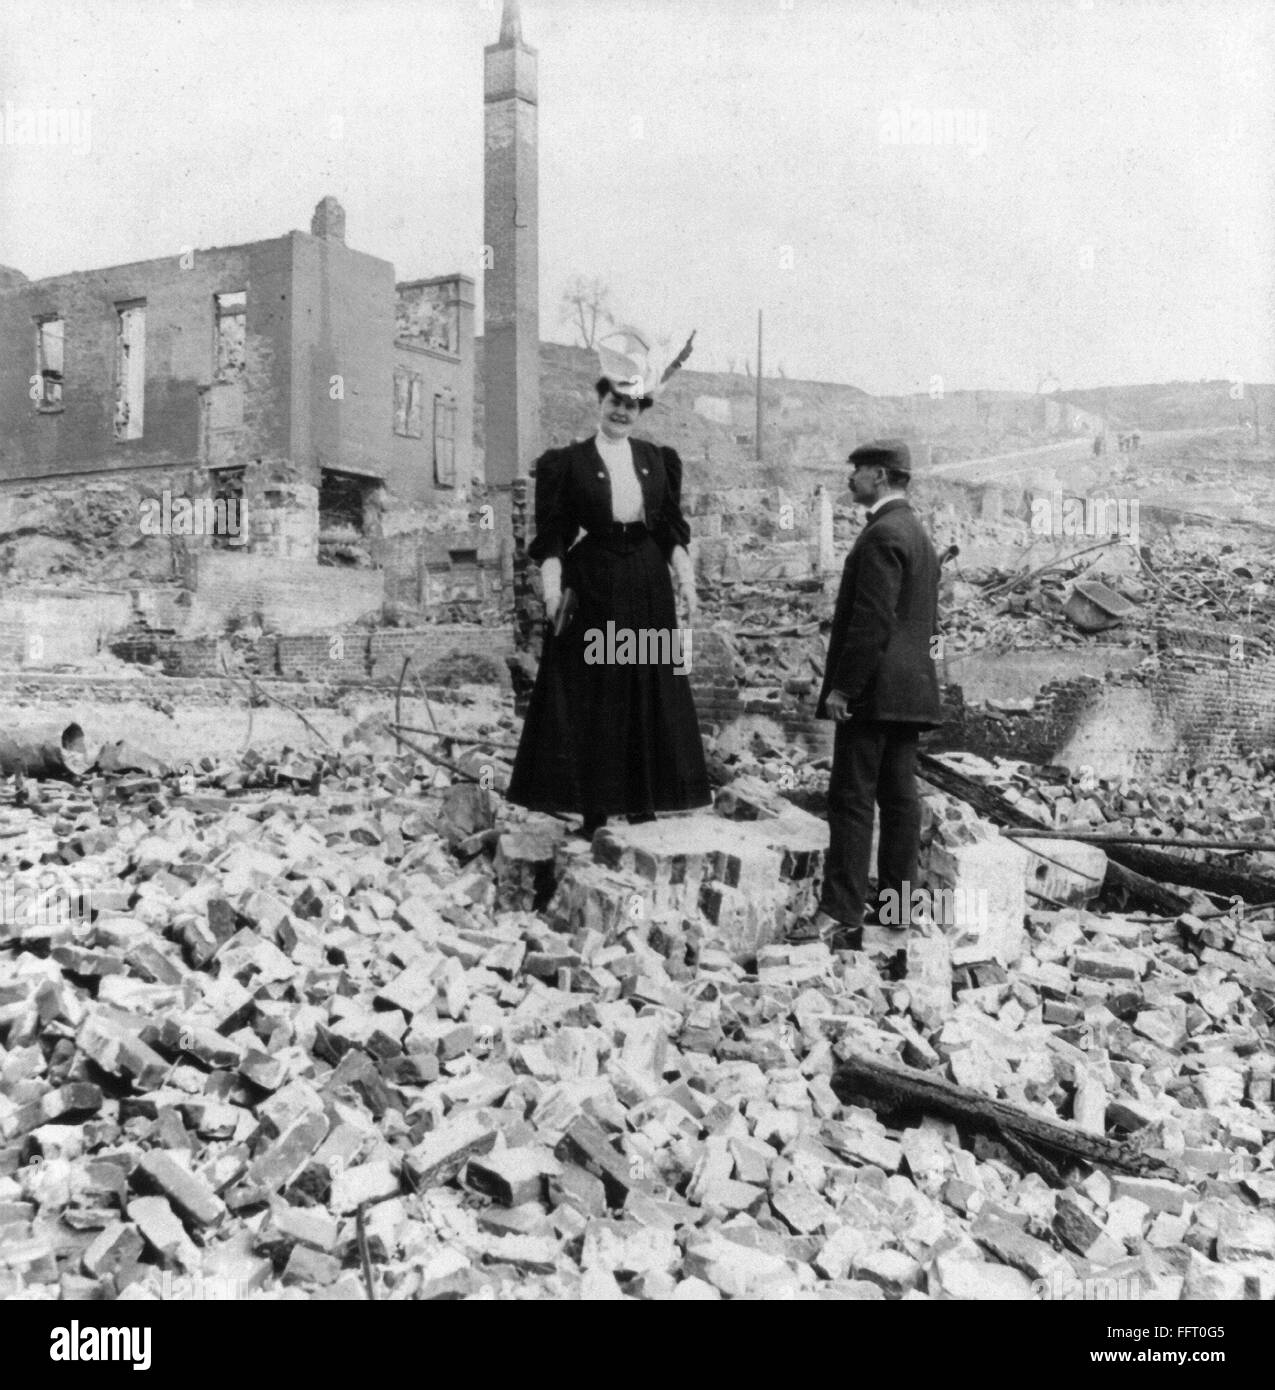
Similar towers are relatively commonplace in Italy and part of the country’s charm. The town of San Gimignano, about 200km from the centre of the Amatrice earthquake, has 14 towers that date as far back as the 12th century – and have consequently survived many earthquakes big and small. Other towers can be seen in Alba in northern Italy. Further afield, a memorable image of the Izmit earthquake in Turkey in 1999 was of the tower of the Golcuk Mosque standing forlornly among the ruins. Photos from the 1906 San Francisco earthquake show a slender tower and an array of chimneys standing in the rubble of the city. In many instances, however, the towers fall, as happened to the Dharahara tower during the magnitude-7.8 Nepal earthquake in April 2015. Why do some of these slender icons survive repeated earthquakes and others fall? An article in The Economist suggested that the clock tower was better constructed than the surrounding buildings, pointing out that it even survived better than a modern school and hospital. The L'Aquila experience suggests that this is probably one part of the story. However, the reality is more complex. Other factors can and do contribute to the resilience of buildings. 
On shaky groundIt is very likely that the clock tower’s survival was influenced by the relationship between the frequency of the earthquake waves and the natural resonance of the building. To understand why, we have to consider how earthquakes interact with buildings. Earthquakes generate seismic waves that pass through the ground. Like ocean waves, they have peaks and troughs. The frequency of the wave is related to its “period” – the time taken for one complete waveform (including a peak and a trough) to pass. A building has a natural period that causes it to vibrate back and forth. Think of a child on a swing – a swing with short ropes will complete a full cycle much more quickly than a long swing. The same is true of buildings with different heights. A building is effectively an upside-down pendulum and taller buildings have longer natural periods of oscillation (swinging back and forth). The ground also has a preferred period at which it oscillates. Soft sediment in a river valley will oscillate over longer periods, and hard bedrock over shorter ones. High-frequency (short period) earthquake waves are therefore amplified in bedrock, such as the site of Amatrice, and are the dominant frequency radiated by small to moderate and shallow earthquakes such as last week’s. Low-frequency (long period) earthquake waves are amplified in sediment and form a greater part of the seismic energy radiated by larger earthquakes, such as the Tohuku earthquake in Japan and the Nepal quake that felled the Dharahara tower. When the resonant frequency of the ground coincides with the resonant frequency of the building, the structure will undergo its largest possible oscillations and suffer the greatest damage. The rigidity and distribution of mass along the height of a building also have a big effect on the likely damage sustained in a given earthquake, as this governs the way the induced forces are distributed. You can try this for yourself by experimenting with a broom handle and a 30cm ruler. Held vertically, the top of the broom handle will do little if you vigorously shake its base with small movements, whereas the ruler will oscillate under the same shaking. Slow the shaking down and the handle will begin to whip back and forth while the ruler settles down. Place a large mass on the end of either the ruler or the broom handle and the characteristics will change. The concept is beautifully demonstrated in a video by Robert Butler of the University of Oregon. A resonant problemOf course, real structures and real earthquakes are far more complex. Real structures have many natural frequencies, and earthquakes vibrate across a spread (or spectrum) of frequencies. Destruction occurs when any of a buildings’s natural frequencies coincide with any of the dominant frequencies of the earthquake. In some situations, there may be just a few structures that avoid this dangerous combination, such as the clock tower at Amatrice, or the chimneys of San Francisco. The characteristics of shaking at Amatrice have not yet been published, but it is highly likely that the tower is standing not only because it was built well in the first instance, but also because it is just the right size and shape to survive the frequency of shaking that occurs during Italy’s moderate-magnitude earthquakes. This process is equally important in other regions. The magnitude-6.8 Myanmar earthquake on August 24 damaged many historic temples in the Irrawaddy Valley, but none appears to have collapsed. These high-but-squat structures are susceptible to high-frequency shaking, whereas the passage of earthquake waves through alluvium is likely to have amplified mainly low-frequency earthquake waves. 
Notably, much of the damage to the temples seems to have occurred as a result of the collapse of recent cheap “restorations”. Building practices are extremely important in mitigating the effect of shaking on buildings. Modern buildings are commonly fitted with devices to reduce the effects of resonance. Engineered solutions are available to retrospectively enhance the performance of unreinforced masonry buildings, with little impact on their aesthetics. In Italy, this retrofitting needs to be done as quickly as possible before the next earthquake. This will be a costly exercise. Even apparently resilient medieval towers may require retrofits, because they have commonly accumulated a degree of damage. However, Italy is a globally important cultural and tourism hub, and her earthquake-prone buildings, like those in Myanmar, are part of our collective heritage. Italy should not be left to struggle alone with the management of earthquake-prone building hazards. Brendan Duffy, Lecturer in Applied Geoscience, University of Melbourne; Colin Caprani, Lecturer, Structural Engineering, Monash University, and Mark Quigley, Associate professor, University of Melbourne This article was originally published on The Conversation. Read the original article. Italy's deadly earthquake is the latest in a history of destruction - from The Conversation25/8/2016
Brendan Duffy, University of Melbourne; Mark Quigley, University of Melbourne, and Mike Sandiford, University of Melbourne
The Appenines region of central Italy has been struck by a deadly earthquake, with a magnitude of 6.2. The quake, which had an epicentre roughly 10km southeast of Norcia, Italy, occurred just over seven years after the 2009 L'Aquila earthquake that killed more than 300 people only 90km away. The latest earthquake occurred at 3:36 am local time. The number of fatalities is unknown at time of writing but already exceeds 100. Buildings have collapsed in nearby Amatrice and residents are reportedly trapped in rubble. 
Fracture zoneThis earthquake is no surprise. Italy is prone to earthquakes; it sits above the boundary of the African and European plates. The oceanic crust of the African plate is subducting (sinking) under Italy, creating iconic natural features such as the volcano at Mount Vesuvius. These plates are converging at a rate of around 5mm each year. Both the L’Aquila and Norcia earthquakes were located below the central Appenines, which form the mountainous spine of Italy. The Earth’s crust under the Appenines of central and western Italy is extending; eastern central Italy is moving to the north east relative to Rome. As a result, this region experiences normal faulting: where one part of the earth subsides relative to another as the crust is stretched. The fault systems in the central Appenines are short and structurally complex, so the earthquakes are not large by global standards, the largest almost invariably hover around magnitude 6.8 to 7.0. But because the quakes are shallow and structurally complex, and because many of the local towns and cities contain vulnerable buildings, strong shaking from these earthquakes has the potential to inflict major damage and loss of life in urban areas. This region also seems to be particularly prone to earthquake clustering, whereby periods of relative quiet are interrupted by several strong earthquakes over weeks to decades. A history of quakesBoth Norcia and L’Aquila feature prominently at either end of a zone of large Appenine earthquakes. This zone has produced many strong earthquakes. The latest Norcia earthquake occurred only around 90km northwest of the L’Aquila earthquake and very close to the epicentre of the 1979 Norcia earthquake, which had a magnitude of 5.9. But the area’s earthquake history can be traced back over seven centuries. During this period, this region has been hit by at least six earthquakes that have caused very strong to severe shaking. Amatrice, so badly damaged in the most recent quake, was severely damaged in 1639. A few decades later, in 1703, roughly 10,000 people were killed in Norcia, Montereale, L’Aquila and the surrounding Appenine region in three magnitude 6.2-6.7 earthquakes. Parts of Norcia were subsequently built upon the surface rupture created in the 1703 earthquake. Another earthquake in 1997 killed 11 people. In this most recent event, an estimated 13,000 people would have experienced severe ground shaking, probably lasting 10-20 seconds. The estimated damage of this latest earthquake will almost inevitably exceed US$100 million, and may top US$1 billion. Amatrice appears to be among the populated areas that were most severely affected. What lies ahead?The region now faces a prolonged and energetic aftershock sequence; over the first 2.5 hours following the mainshock, at least four earthquakes of around magnitude 4.5 were recorded in the region by the US Geological Survey. More than 10,000 aftershocks were recorded following the L’Aquila earthquake in 2009. We note that within the region, there is excellent and continuously improving scientific information about the hazard. But the knowledge of the hazard has not always translated well into measures that directly reduce economic loss and fatalities in earthquakes. Following the L'Aquila earthquake, six scientists were convicted of manslaughter for failing to inform the public adequately of the earthquake risk. Although the charges were subsequently dropped, this marked a major development in the way blame is apportioned after large natural events, particularly with regard to effective hazard communication. Numerous vulnerable buildings remain, and the recovery process is commonly plagued by long disruptions and inadequate government funding to recover rapidly. Both the 2009 L’Aquila earthquake and this most recent quake highlight just how important it is to translate hazard assessments into improving the resilience of infrastructure to strong shaking. The focus should remain on linking science, engineering and policy, this is often the biggest challenge globally. Brendan Duffy, Lecturer in Applied Geoscience, University of Melbourne; Mark Quigley, Associate professor, University of Melbourne, and Mike Sandiford, Chair of Geology & Redmond Barry Distinguished Professor, University of Melbourne This article was originally published on The Conversation. Read the original article.  http://www.cooperativeindividualism.org/cartoon_my-home-is-my-castle.jpg http://www.cooperativeindividualism.org/cartoon_my-home-is-my-castle.jpg Most people in western society drive. Drivers are taught and required to be hazard aware. They are required to pay attention and can be severely penalized for failing to do so. Most people, drivers or otherwise, work for a living, and the terms of their employment require them to be hazard aware. Failure to work within health and safety regulations can result in dismissal. Driving and working generally don’t account for more than 40% of a person’s life. So, what else do we do? Some of us get closer to nature. Most people – drivers, workers or others – spend some time in outdoor recreation, whether on the beach, at the pool, on the bike, or somewhere else. In outdoor activities it is pretty unwise, and possibly even catastrophic, not to pay at least some attention to potential hazards. Beaches can kill not just by drowning but by heat-stroke or due to recklessness of another beach-goer. Recklessness that causes a hazard to others is seriously frowned on and may be illegal. We plan for hazards almost automatically as we pack our picnic and throw in the antihistamines and first-aid kit.
So, what do we do when we are not working, driving or spending time outdoors? We sit on the couch and watch television, play on mobile phones, drink cups of tea and the occasional beer, and sleep. No hazards here we think. But are we right? In the other settings where we live out parts of our life we are warned about the hazards repeatedly. The road toll, the drowning toll, work accident data on big display boards. Occasionally we hear of accidents in the home, but to most people, our homes are our castles, and sometimes the rates might feel that way too. Just remember, you spend up to 50% of your life in your home, so the chances are reasonable that your castle is where you will be during the next earthquake. In order to plan for seismic hazard, and understand what to have in your seismic-aid kit, you need to have some idea of what you are dealing with.  Google map showing the original interpreted location of the earthquake, just near Lake Coleridge. As you can see, over the ensuing hours the earthquake location and magnitude were both revised. Although the revised location is closer to the Alpine Fault, the reduced magnitude reduces the area-wide influence of this single event. This morning 6th January 2015, at 06.48 am, an earthquake of M~6 shook the Southern Alps of New Zealand (see Geonet record here). It provided a nice example of the intricacies of earthquake science, and the need for the media and scientists to keep a fluid mindset in the first few hours after an event. Too much speculation soon after an event is nothing more than that - SPECULATION.
I have long wished for a good novel with a geo-hero, preferably somewhat believable. Now I find that Sarah Andrews is the person I have been looking for. Sarah holds an MS in geology, having researched uranium deposits in alluvial fans and worked in the oil industry. She uses geological settings as a framework for her novels, and provides easy-reading education for the public about geology and geologists. Long may she continue!
Sarah's books on Amazon. |
BrendanTectonics and earthquakes Archives
February 2021
Categories |
 RSS Feed
.jpg)
|
Life is too short to look at ugly rocks
|